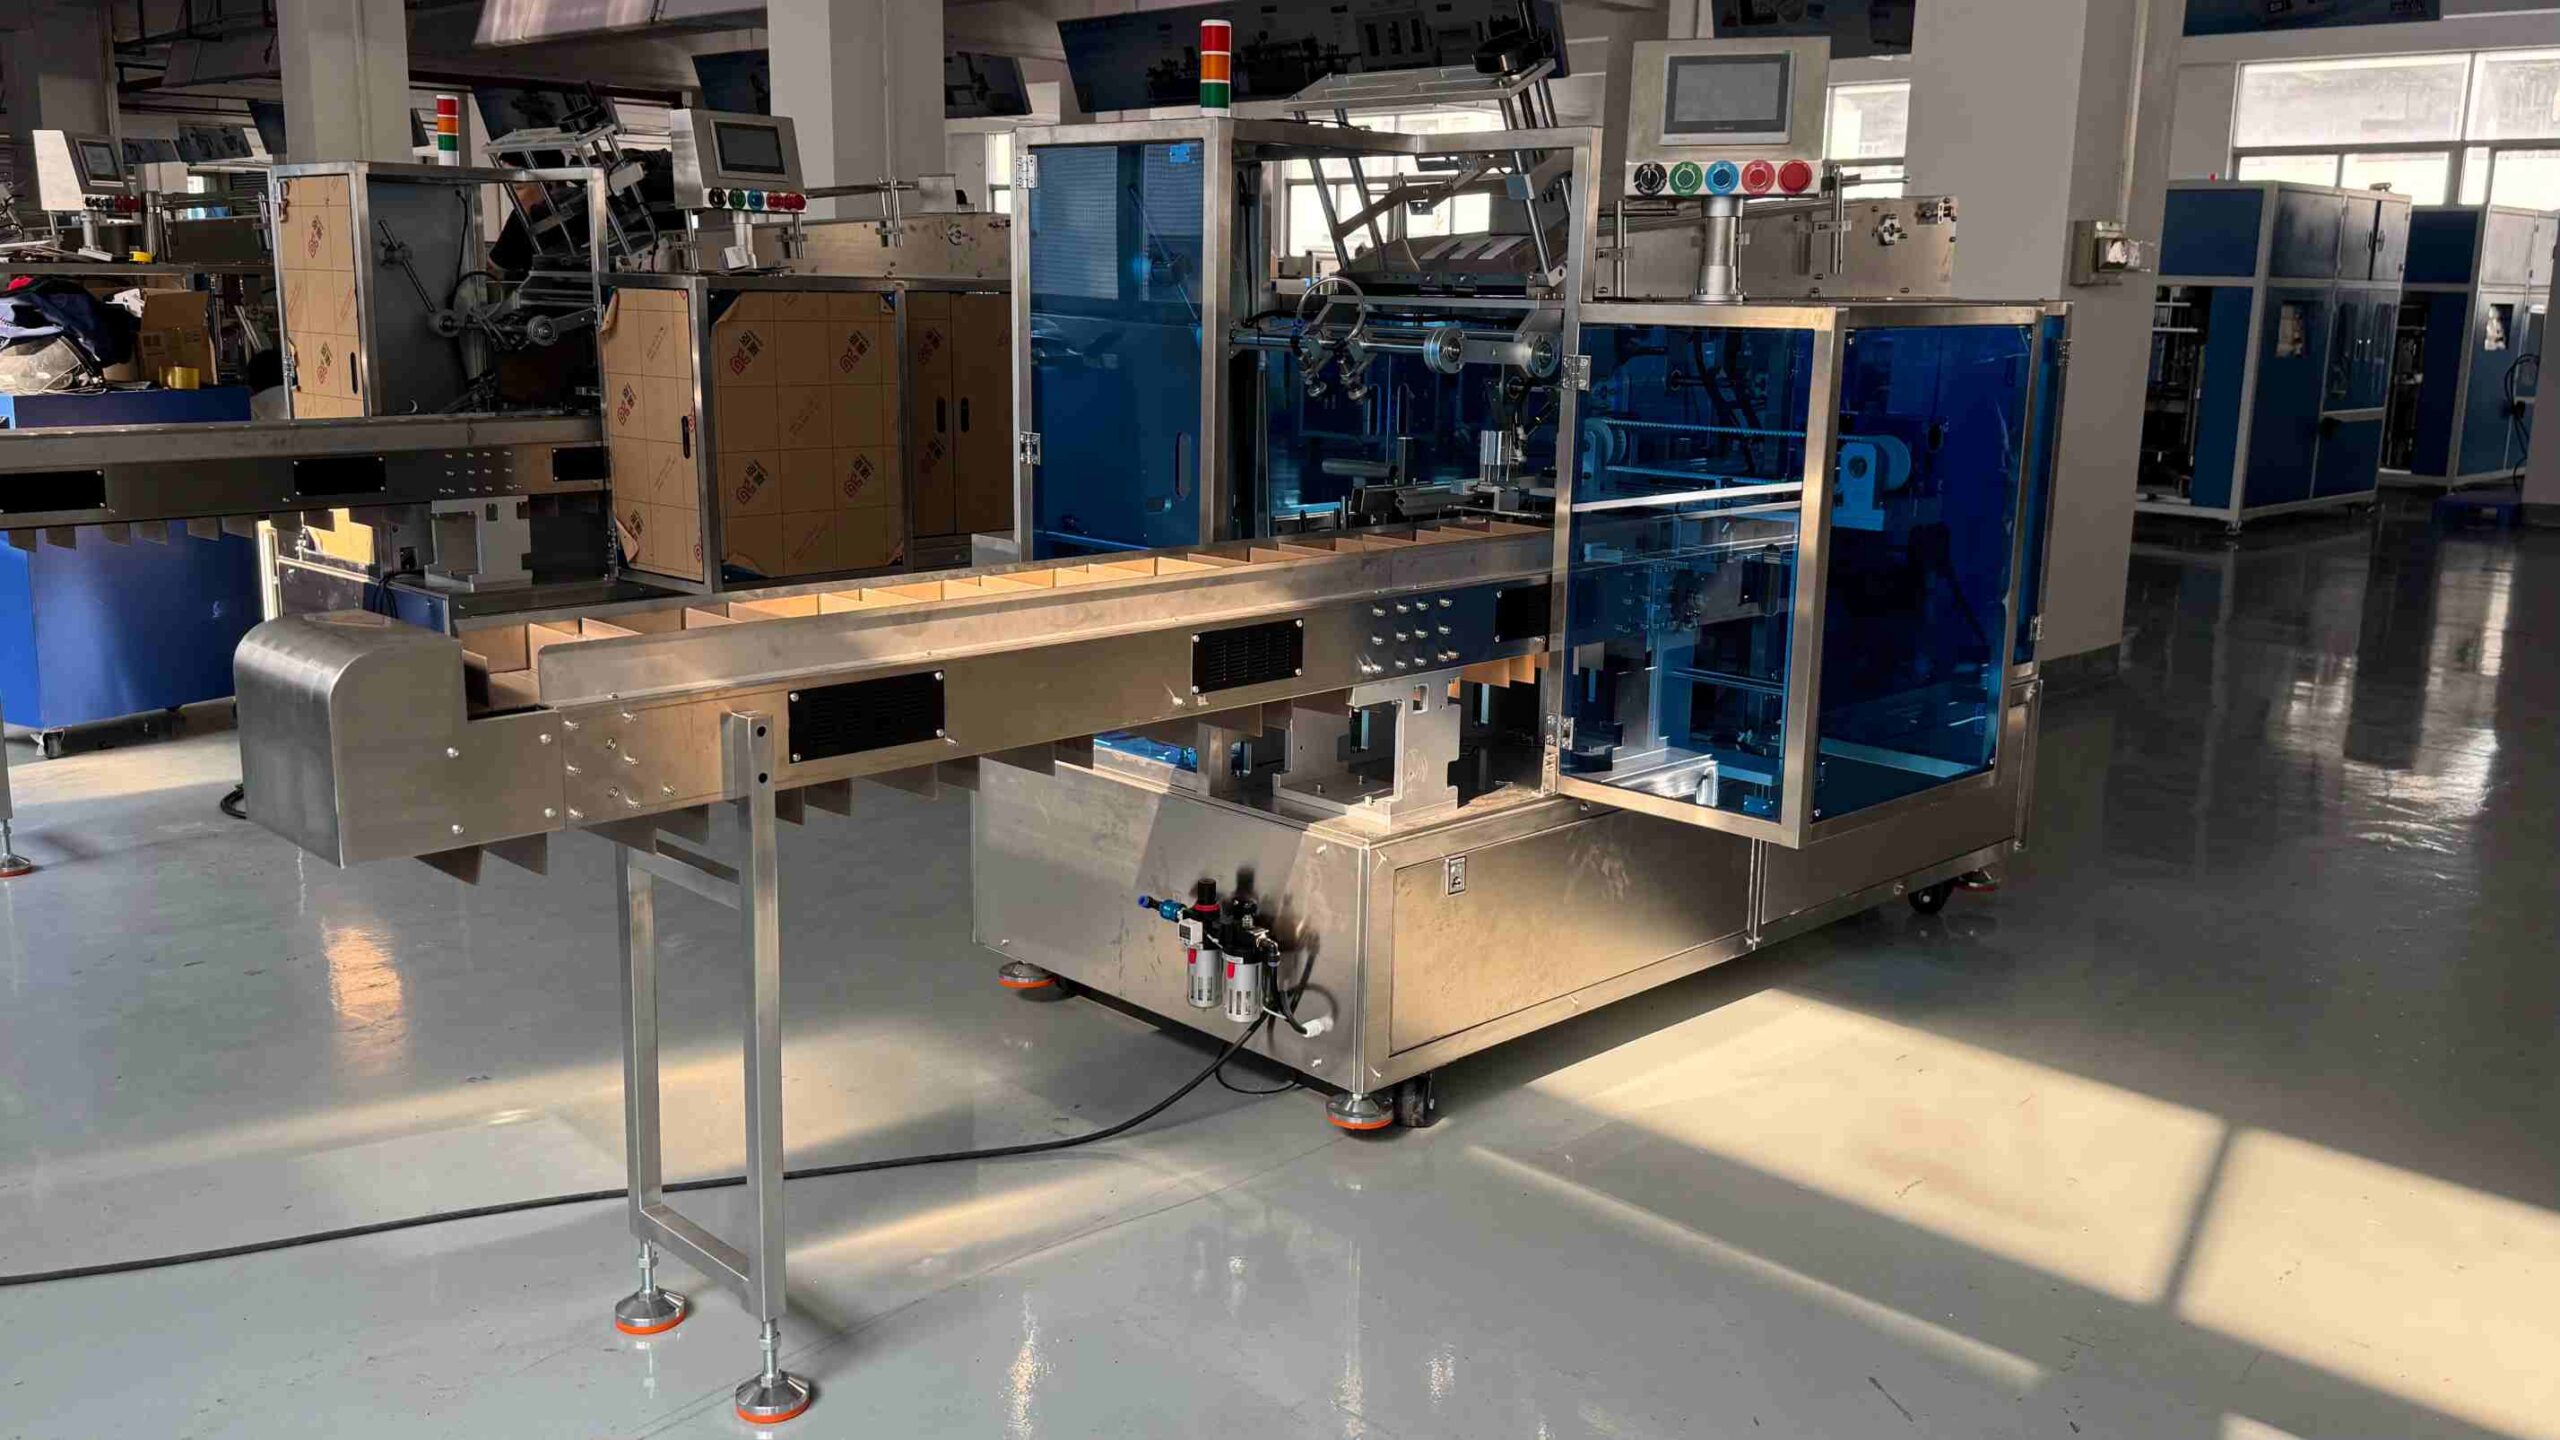
A contract manufacturer in Jalisco installed a new cartoner rated at 200 cartons per minute, and for a month the plant manager could not understand why the line shipped the same number of pallets as before. The cartoner was not the problem. Neither was the case packer. The palletizer at the end of the line had been sized for the plant’s old output, and it was the true ceiling the whole time. The faster machine simply spent more of each hour waiting.
That mistake is common and entirely avoidable, because it comes from designing a line in the wrong direction. Most teams start at the machine they are most excited to buy and add stations until the line reaches the dock. A line built this way has a top speed equal to its slowest station, which is usually the one nobody re-checked.
This guide is the other direction: a calculable framework for end of line packaging system design. You will start at the finished pallet and derive every upstream rate from it. Then size buffers as a function of time, choose an accumulation strategy, and place inspection and reject stations so a single defect never stops the line.
End of line packaging system design starts with the capacity target
Every line design begins with a single number, and getting it wrong makes every downstream decision wrong too. The number is the capacity target at the palletizer: how many finished cases per hour, or pallets per shift, the line must produce.
Express it at the finished-goods end for a reason. Upstream stations are means to that end, and their required rates only make sense once the end is fixed. A cartoner is not “a 200 cpm machine”. It is a machine that must feed a case packer that must feed a palletizer producing a defined number of pallets per shift. The second framing is a design; the first is a shopping decision.
Three inputs define the target, and each one is easy to get wrong:
- Peak versus average. Design the machines to cover the peak, but do not over-capitalise the buffers for it. Machines sized to the average will fail every peak; buffers sized to the average are what keep the machines from needing to be sized to the worst case. The target should be the peak day’s required output, not the annual average divided by 250.
- Available hours. A realistic figure subtracts planned changeovers, washdowns, breaks and the unavoidable short stops that the buffer is meant to absorb. If you plan against gross hours, you have already built a shortfall into the design.
- Product mix. One SKU at a fixed format runs at the station’s rated rate. Ten SKUs with format changes several times a shift run at an effective rate that is meaningfully lower, because changeover minutes are production minutes you do not get back. The more SKUs, the more the mix number matters. We treat changeover as a rate input later, but it belongs in the target from the start.
| Target input | What to record | Common error |
|---|---|---|
| Peak output | Cases/hour and pallets/shift on the busiest day | Using average output |
| Available hours | Peak shifts × usable hours, minus planned stops | Counting gross hours |
| Product mix | SKUs, formats, changes per shift | Assuming one stable format |
| Pack counts | Units per carton, cartons per case, cases per pallet | Mixing unit ladders |
For the broader map of how these stages connect before goods reach the dock, our end-of-line packaging overview lays out the full sequence. This guide stays on the design method.
Work backward from the palletizer, not forward from the cartoner
Once the target is fixed, the design moves in one direction: from the finished pallet back through the case packer to the cartoner and its infeed. Each step is a unit conversion, and the conversions are where mismatches hide.
Start from cases per hour at the palletizer. Then convert backward:
- Palletizer. Cases per hour required, factored by pallet pattern and layer stability. This is the rate the palletizer must sustain, including the time it spends changing pallet or pattern.
- Case packer. Take cases per hour, divide by cartons per case, add the rejection and rework allowance. That gives the cartons per hour the case packer must consume. Match this to the case packer’s sustained rate at your case size and product pattern.
- Cartoner. Take cartons per hour, add the upstream rejection allowance, and compare to the cartoner’s sustained rate. Remember that a cartoner also inserts leaflets and codes cartons, and those functions consume cycle time.
- Primary packaging and infeed. Take cartons per hour, multiply by units per carton, and you have the product rate the primary line and the cartoner infeed must deliver.
Upstream of the cartoner, that rate may begin on bagging and primary packaging equipment or on a filling line; either way, the infeed must be able to deliver the rate the chain demands.
Every arrow in that chain is a place to build in a margin, and every margin is capacity you are deliberately buying. The rule is to carry a modest, deliberate headroom at each station and to know where you put it, rather than discovering accidental shortfalls in commissioning.
The failure mode to avoid is comparing across ladders. A cartoner quoted at 200 cartons per minute is not comparable to a case packer quoted at 30 cases per minute unless you know the cartons-per-case count. If a case holds 12 cartons, the packer consumes 360 cartons per minute at its rated speed, which is faster than the cartoner can feed. Reverse the numbers and the cartoner starves the packer instead. Neither machine is wrong; the design did not do the arithmetic.
Typical speed ranges by station
The table below gives empirical ranges by station type, reported by equipment makers and integrators. Treat them as planning bands, not specifications; your real number depends on product, format, board quality and feed.
How to read these ranges
| Station | Typical sustained range (industry) | Unit ladder note | What usually caps it |
|---|---|---|---|
| Cartoner (intermittent) | ~30–120 cartons/min | Cartons consumed | Feeder reliability, not cycle time |
| Cartoner (continuous motion) | ~200–400+ cartons/min | Cartons consumed | Product feed synchronisation |
| Case packer (top-load / robotic) | ~10–40 cases/min | Cartons per case | Product pattern and handling gentleness |
| Case packer (wrap-around, drop) | ~25–80 cases/min | Cartons per case | Collation and blank quality |
| Case erector | ~10–30 cases/min | Cases formed | Blank quality, magazine feed |
| Case sealer | ~15–40 cases/min | Cases sealed | Flap folding, glue or tape reliability |
| Palletizer (robotic) | ~10–25 cases/min | Cases per pallet | Pattern complexity and tooling |
| Palletizer (conventional/layer) | ~25–35 cases/min | Cases per pallet | Pattern changes, layer forming |
Two cautions. Nameplate versus sustained: a quoted rate is often a short burst at ideal conditions, so ask what the machine holds across an eight-hour shift on your worst product. Endpoints mislead: a cartoner described as “200 to 400” is not twice as capable at the top end if your product cannot feed that fast. The feeder usually matters more than the headline cycle rate. On the case-packer rows, the axis you choose is itself a rate input; our guide to case packer loading axis selection compares top load, side load and wrap-around by product.
The design consequence: balance each station’s sustained rate to the target with the smallest sensible headroom, then use buffers to absorb the mismatch rather than oversizing every machine. That is line balancing packaging in practice, and the wider discipline of balancing a line while tracking OEE is set out in OMAC line balancing and OEE guidance.
Buffer sizing is a time calculation, not a conveyor length
The most important idea in end-of-line design is also the most misunderstood: a buffer’s capacity is a duration, not a distance. A conveyor that holds 60 metres of product means nothing until you know how many minutes of upstream output that represents.
Four steps to size a buffer
Buffer capacity is expressed in minutes of upstream production, and you derive it like this:
- List the downstream stop events. Not theoretical failures, but the stops that actually occur: carton jam clears, glue warm-up, sensor faults, a pallet change, a small manual intervention.
- Record typical durations. For each event type, note how long it usually lasts, not how long the worst one lasted.
- Choose the design stop. Pick the stop duration the buffer should ride through, typically a common, short stop rather than a rare, long one. Covering the 90th percentile of stop durations is usually a fair trade; covering the single worst shift is expensive and rarely used.
- Multiply by the upstream rate. Buffer minutes of output times the upstream rate gives the units the buffer must hold. Convert that back to physical length using the product pitch.
Buffer capacity needed = (design stop duration + restart and ramp allowance) × upstream rate
In plain terms, buffer size equals the stop duration you choose to cover times the upstream rate. That formula is a method, not a guarantee of a specific number of minutes. The right buffer for your line is the one that covers the stops you actually experience, and the only way to know those is to measure them on your own equipment. What the method buys you is a defensible size instead of a guess. As you set it, map your accumulation conveyor sizing from measured stops rather than from a wish, because the numbers you feed in decide the answer you get.
A subtlety that catches design teams: a long accumulation table can hold very little. A 2023 bakery line in Malaysia found this during a stop audit. The accumulation table looked generous because it was physically long, but the products sat so far apart that it held only about forty seconds of cartoner output at peak rate. Tightening the product pitch let the same table hold several minutes of output without adding a metre of conveyor. (Synthesized composite scenario, not a specific UBL customer.)
The published guidance points the same way. Packaging World’s best practices for buffering and end-of-line design suggests running the first machine upstream at about 110% of the capacity of the next, in 10% steps, so the line can catch up after a stop. On a light, easily scarred snack cartoning line, that extra downstream headroom is what keeps a short stop from becoming a lost shift.
Three accumulation strategies: ZPA, single-file and direct coupling
Once you know how many minutes of buffer you need, you choose how to provide it. There are three broad strategies, and they are not interchangeable.
ZPA vs mass accumulation vs direct coupling
Zero-pressure accumulation (ZPA). Zones of conveyor accumulate product with deliberate low or no back pressure between them. ZPA protects fragile or easily scarred products, absorbs stops smoothly, and releases product in a controlled sequence. It costs more and needs more controls, but on glass bottles, printed cartons and soft packs it is often the only option that does not damage product while it waits.
Mass single-file (bulk) accumulation. Product queues on a single lane or table with contact between items. It is cheaper and denser than ZPA, and it works well for robust, uniform products that tolerate touching. The trade-off is back pressure: near the front of the queue, items press on each other, and damage accumulates the longer the queue sits.
Direct coupling (no buffer). The upstream station feeds the downstream station with no accumulation between them. It has the smallest footprint and lowest cost, and it is a legitimate design when both stations can stop and restart cheaply and quickly, or when the downstream station essentially never stops independently. It is a poor choice when restarting either station costs more than the buffer would have.
| Strategy | Best for | Cost and footprint | Main risk |
|---|---|---|---|
| Zero-pressure accumulation (ZPA) | Fragile, printed, or scarred products | Higher cost, more controls | Over-engineering a robust product |
| Mass single-file accumulation | Robust, uniform products | Moderate cost, dense | Back-pressure damage in long queues |
| Direct coupling (no buffer) | Stations that stop and start cheaply | Lowest cost and footprint | One station’s stop stops the line |
The decision is driven by two questions. How much does a stop cost you (restart time, scrapped product, lost seconds)? And how much surface damage can your product take while stationary? Where stops are expensive and the product is fragile, ZPA earns its cost. Where stops are cheap and the product is robust, mass accumulation is enough. Where neither station ever stops independently, direct coupling is honest engineering rather than a shortcut.
Where reject handling, checkweigher and metal detection belong
Inspection and reject systems are usually added to a line after the main machines are chosen, and that is why they so often wreck the efficiency the main machines were bought for. Placement matters as much as capability. Machine-level risk control runs alongside it: the ANSI/PMMI B155.1 packaging machinery safety standards frame how suppliers and users share responsibility for guarding and safe operation, which is the backdrop every reject lane is designed against.
The reject granularity rule
Two principles govern placement:
Principle 1: reject granularity should match value at risk. A defect should be rejected at the smallest unit that makes economic sense. A metal detector placed after case packing can only reject a whole case, discarding eleven good cartons to remove one bad one; the same detector placed after the cartoner rejects a single suspect carton.
Principle 2: a reject must never starve the station feeding it. A reject station that pauses the upstream flow turns every defect into a line-wide micro-stop. Design reject lanes as takeaway paths that divert a single unit without interrupting the main flow, so a reject costs you one unit rather than a few seconds of the whole line.
With those principles, the usual placement rules fall out:
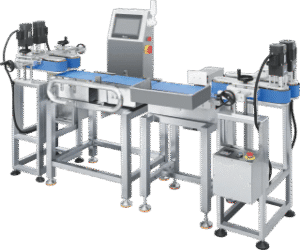
- Checkweigher goes immediately after the stage that determines weight, normally after carton filling and before case packing. Placed before filling, it weighs the wrong thing; placed after case packing, it cannot isolate the offending carton.
- Metal detection goes as early as product handling allows, typically after primary filling and before or at cartoning, so rejection granularity stays small and contamination is caught before value is added by further packaging.
- Vision and code verification go where the code or the defect is created and still visible, and where a rejected unit is still cheap to discard.
A plant that ignores this pays twice. A weigher placed too late finds defects only after they are cased; a reject lane wired to pause the infeed turns each defect into a stop. Both errors cap output without showing up as a machine fault, which is why they survive so long unnoticed.
How changeover windows change buffer demand
Changeover is where rate planning and buffer planning meet, and most line designs treat the two separately. On a single-SKU line, changeover barely appears in the arithmetic. On a multi-SKU line, it is one of the largest consumers of available hours, and it changes how much decoupling you need.
Buffer and changeover interact
The mechanism is straightforward. During a format change on one station, the stations around it may keep running or may have to stop. If the changeover is quick and neighbours keep producing, the buffer requirement is modest. If the changeover forces a stop, the buffer upstream must cover the changeover duration, or the changeover is scheduled as a deliberate line stop with production lost on purpose.
That is why multi-SKU lines often need more buffer, not less, and why the design question is really about which changes happen in series and which in parallel. Reducing changeover time lowers the buffer demand, because a shorter stop needs less product waiting to absorb it. For the reset side of that equation, our guide to format changeover planning is the companion piece.
The practical move is to map changeovers alongside stops when you build your stop list. A ten-minute changeover four times a shift is forty minutes of availability gone, and it belongs in the rate assumption at the start of the design, not a footnote at the end.
Five end-of-line design errors that quietly cap output
These five recur across industries, and each one caps output without ever announcing itself as the cause.
1. Sizing to average, not peak. A line sized to average output will fail exactly when output matters most. Size the machines to the peak day, and let buffers smooth the difference between peak and average rate. This is the same discipline as peak-season line readiness, applied at the design stage.
2. Starving the fastest machine. Buying one high-rate station without matching its neighbours produces a fast machine that mostly waits. The line’s output is set by its slowest station, so capability at one station is worth buying only when the neighbours can keep up.
3. Cutting the buffer to save money. This is the classic false economy, and it usually surfaces only under pressure. A co-packing plant in northern England removed an accumulation section between its cartoner and case packer during a cost review. Months later, a single jam on the case packer during a peak week stopped the cartoner, and the plant lost most of a shift’s output restarting and re-clearing the line. The deleted buffer would have absorbed the jam in seconds. (Synthesized composite scenario, not a specific UBL customer.)
4. Placing inspection so a reject stops the line. As the previous section describes, a reject system wired to pause the infeed turns defects into line-wide stops. It is a placement error, not a machine fault, which is why it hides.
5. Ignoring product mix in the rate assumption. A line specified on one stable format will under-deliver the moment the plant runs multiple SKUs with frequent changes. Multi-SKU rate assumptions must include changeover minutes from the first sketch.
Each of these errors is cheap to avoid at the sketch stage and expensive to fix once the line is running. The best defence is to write the assumptions down and review them before any purchase order.
From capacity target to equipment list
Here is the whole method as a single derivation you can run on your own line. Work down the table, filling each row from the one above it.
| Step | Question | Output | Feeds |
|---|---|---|---|
| 1 | What output must the palletizer deliver at peak? | Cases/hour, pallets/shift | Palletizer sizing |
| 2 | How many cartons per case, and what rejection allowance? | Cartons/hour into the packer | Case packer sizing |
| 3 | How many units per carton, plus rejection allowance? | Cartons/hour from the cartoner | Cartoner sizing |
| 4 | What does the primary line produce per hour? | Product rate | Infeed and primary sizing |
| 5 | What are the typical downstream stop durations? | Design stop duration | Buffer sizing in minutes |
| 6 | How fragile is the product, and how costly is a restart? | Accumulation strategy | ZPA, mass, or direct |
| 7 | Where is the defect created, and what unit should be rejected? | Reject granularity | Inspection placement |
| 8 | How many format changes per shift? | Availability lost to changeover | Rate assumptions, buffer demand |
Run top to bottom and you have a defensible design rather than a machine wish list. The loading method you choose for the case packer is part of that second step. The commercial side of the same design, including freight, duty and commissioning, sits downstream of this calculation rather than in the engineering numbers here. That side is its own exercise, and our guide to total landed cost budgeting covers freight, duty and commissioning.
Design review: If you have your capacity target and pack counts, our engineers will check the rate balance, buffer minutes and reject placement against your layout before you commit capital. See how we approach turnkey line integration →
Rate matching ultimately starts at the front of the line, because a cartoner can only feed what its infeed delivers. If you want the front of the line designed against your downstream target rather than bolted on to it, start with how we build the cartoning machine infeed design.

FAQ
How much buffer should I leave between two stations?
Size the buffer to cover the downstream stop duration you choose to design for, multiplied by the upstream rate, plus a short restart allowance. In practice, cover a common short stop widely rather than the rare long one. Measure your own stop durations first, because a buffer is only as useful as the stops it absorbs.
How do I match a cartoner’s speed to a case packer’s?
Convert both to the same unit before comparing. Multiply the case packer’s cases per minute by the cartons per case to get the cartons per minute it consumes, then compare that to the cartoner’s sustained output. Match sustained rates, not nameplate speeds, and use a buffer for the residual difference.
What is the difference between ZPA and ordinary accumulation?
Zero-pressure accumulation holds product in zones with little or no contact pressure between items, so fragile or printed products are not damaged while they wait. Ordinary mass accumulation lets product queue with contact, which is cheaper and denser but risks back-pressure damage in long queues. Choose ZPA when the product is fragile or easily scarred.
Where should a checkweigher or metal detector go on a line?
A checkweigher goes right after the stage that sets weight, usually after carton filling and before case packing. A metal detector goes as early as handling allows, typically after primary filling, so you reject a small unit rather than a whole case. In both cases, route rejects so they never pause the infeed.
When is a line with no buffer acceptable?
Direct coupling is acceptable when both linked stations can stop and restart cheaply and quickly, or when the downstream station essentially never stops on its own. It is a poor choice whenever restarting either station costs more than the buffer would have, which is most of the time on cartoner-to-case-packer handoffs.